

401k Expense Ratio: What It Is and How to Compare Fees
What your 401(k) expense ratio means for your savings
A 401(k) expense ratio is a fund’s annual operating cost, shown as a percentage of its assets. The cost is built into the fund’s value rather than listed as a separate charge on your statement. To compare funds, check their expense ratios in your plan’s fee disclosure or fund fact sheets, and compare funds with similar goals.
A small fee difference may seem minor today, but it can affect how much stays invested and grows over time. The 401(k) Maneuver team will explain how to read those costs, compare your options, and spot fees beyond the expense ratio.
What is a 401(k) expense ratio and how is it calculated?
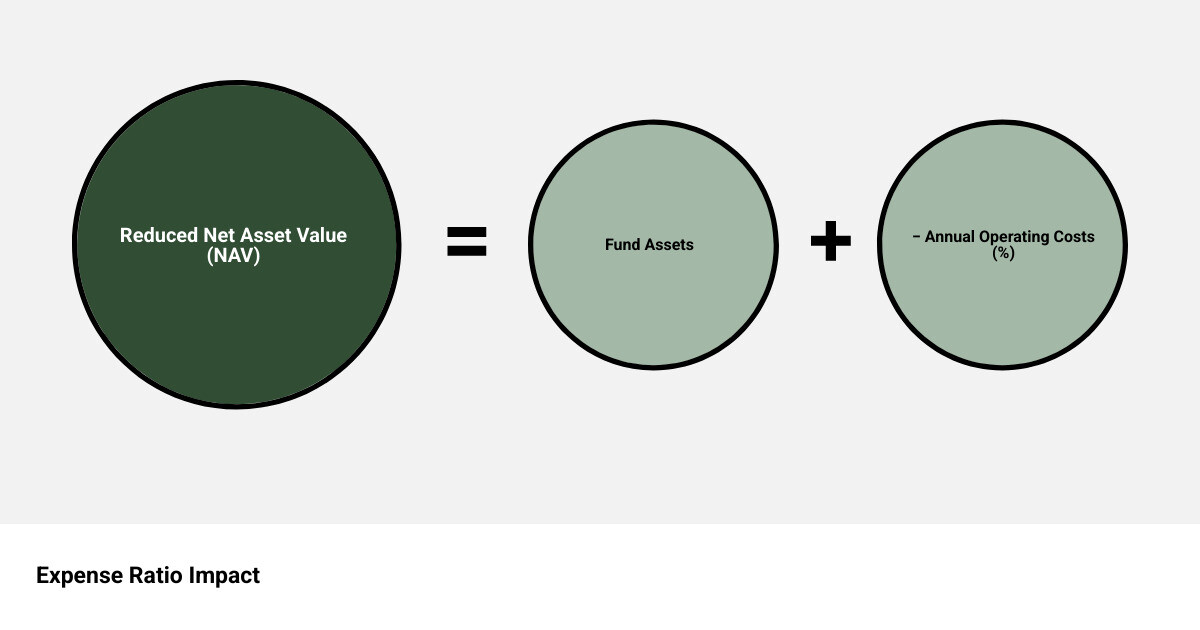
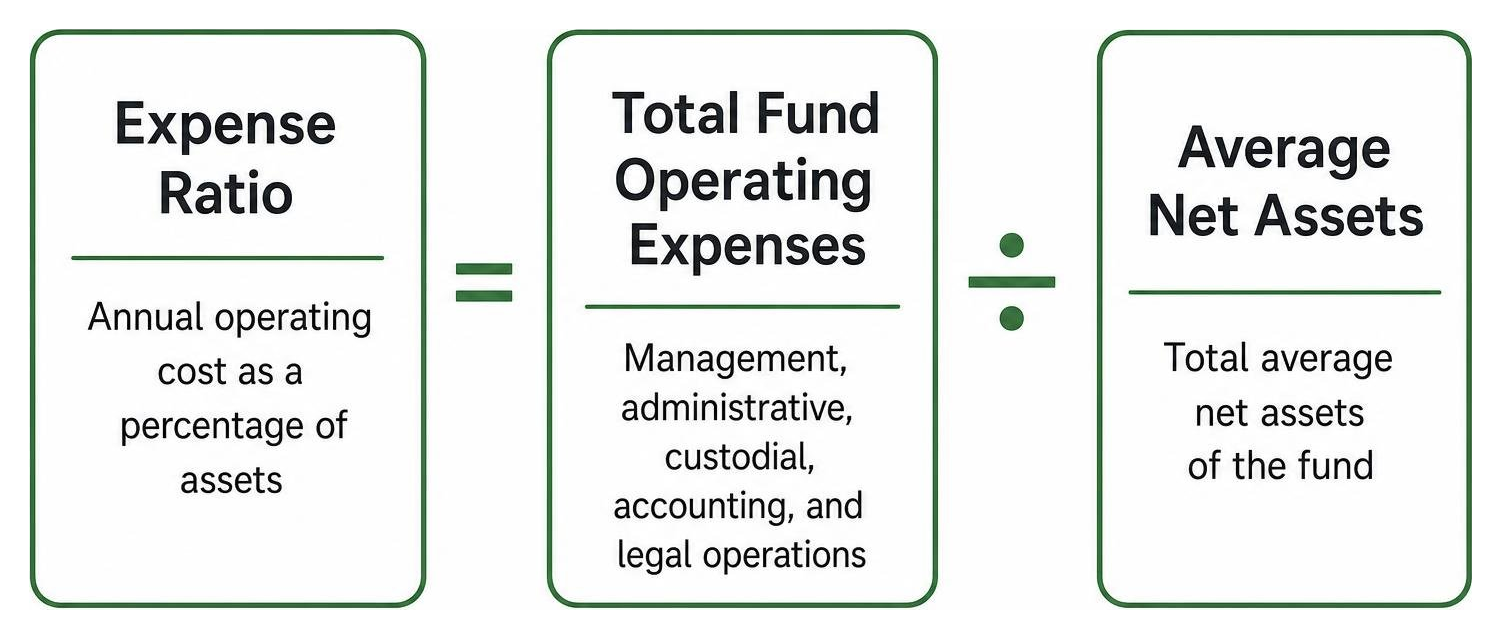
An expense ratio represents the percentage of fund assets dedicated to covering management, administrative, custodial, accounting, and legal operations. Instead of deducting these costs as a separate line item from your paycheck or retirement statement, the fund deducts them continuously from its total assets. This daily deduction directly reduces the fund’s Net Asset Value (NAV), which represents the per-share value of the fund.
Understanding this calculation is an important part of learning how to read a 401(k) statement and evaluating your investment choices. In plain language, the math behind the ratio is straightforward:
Expense Ratio = Total Fund Operating Expenses divided by Total Average Net Assets
For example, if a mutual fund manages $100 million in total assets and incurs $500,000 in annual operational expenses, its expense ratio is 0.50%. This means you indirectly pay $5 annually for every $1,000 you have invested in that fund.
Gross vs. net expense ratios explained
When you review a fund prospectus or fee disclosure notice, you may see two different figures: a gross expense ratio and a net expense ratio. The gross expense ratio reflects the total percentage of operating costs before any fee waivers, contractual caps, or reimbursements from the fund company.
The net expense ratio reflects the actual cost charged to investors after applying those temporary waivers or discounts. Fund providers sometimes implement fee caps to keep costs competitive for a specific period. It is helpful to check the expiration date on those waivers, as an expiring cap can cause the net fee to rise toward the gross expense ratio over time.
Active vs. passive investment cost structures
Workplace retirement plans typically offer both actively managed funds and passively managed index funds. The fundamental differences in how these funds operate lead to distinct cost structures.
- Actively Managed Funds: These portfolios rely on a team of research analysts and managers who make frequent buying and selling decisions aiming to outperform a market benchmark. This active research and higher portfolio turnover generate ongoing management expenses, trading commissions, and administrative overhead.
- Passively Managed Index Funds: These funds track a specific market benchmark (such as the S&P 500) rather than attempting to beat it. Because securities are held long term and trades occur primarily when the underlying index changes, operational and management costs remain low.
| Investment Feature | Actively Managed Funds | Passively Managed Index Funds |
|---|---|---|
| Primary Objective | Aims to exceed benchmark performance | Aims to match benchmark performance |
| Management Style | Ongoing security research and active trading | Rule-based index tracking |
| Trading Turnover | Moderate to high | Low |
| Internal Expense Range | Generally higher | Generally lower |
Neither management approach is universally right for every saver. Some investors prefer the lower ongoing costs of index funds, while others value active strategies during specific market conditions.
How fees impact long-term 401(k) account growth
Over a multi-decade career, small differences in fund expenses can compound significantly. Because fees reduce your account balance, they also reduce the amount of money remaining in your portfolio to earn potential investment returns in future years. Understanding what’s hurting your 401(k) helps ensure unnecessary costs do not erode your retirement preparation.

To illustrate the mathematical effect of compounding costs, consider a hypothetical scenario involving two participants who each invest $25,000 over a 35-year career, assuming an average annual gross investment return of 7%:
- Investor A (0.50% total annual fees): With net growth of 6.50% per year, the account grows to approximately $227,000 at retirement.
- Investor B (1.50% total annual fees): With net growth of 5.50% per year, the account grows to approximately $163,000 at retirement.
In this hypothetical example (which does not represent actual market performance or account for taxes), a 1.00% difference in annual expenses results in an account balance that is roughly 28% lower over 35 years.
What is the average 401(k) expense ratio?
Plan costs have steadily declined over the past two decades across the retirement industry. According to research from the Investment Company Institute (ICI), the average equity mutual fund expense ratio paid by 401(k) participants fell from 0.76% in 2000 to 0.26% in 2024. During that same period, the average expense ratio for target-date mutual funds decreased from 0.67% in 2008 to 0.29% in 2024.
Costs often vary depending on the asset class and the size of your employer’s plan. According to the Investment Company Institute (ICI) 2024 retirement fee research, overall 401(k) participant-weighted expense ratios across all mutual fund assets averaged approximately 0.52%. Larger workplace plans frequently qualify for institutional share classes with lower expense structures due to economies of scale.
What is considered a good expense ratio for 401(k) plans?
A good expense ratio depends on the asset class, the fund structure, and whether the strategy is active or passive. When evaluating your investment options, broad industry benchmarks generally suggest:
- Broad Market Index Funds: An expense ratio below 0.20% (with many broad index funds available under 0.10%).
- Target-Date Funds: An expense ratio below 0.30% to 0.40% for blended index-based options.
- Actively Managed Equity Funds: An expense ratio below 0.50% to 0.75%.
Comparing a fund’s expense ratio against peers within the exact same asset category provides the most accurate assessment of whether its costs are reasonable.
Where to find and evaluate your plan fees
Federal regulations require transparency regarding all retirement plan expenses. To review what you pay, consult these standard documents provided by your plan administrator:
- Annual Participant Fee Disclosure Notice: Also known as the ERISA Section 404(a)(5) disclosure, this document lists all fund investment options, their historical performance, and their gross and net expense ratios.
- Fund Fact Sheets and Prospectuses: These sheets detail investment objectives, turnover rates, top holdings, and operating costs.
- Quarterly Account Statements: These statements report individual transactional fees (such as loan maintenance) and any direct administrative deductions charged to your account.
You can review formal participant disclosure requirements and retirement rights directly through the U.S. Department of Labor Employee Benefits Security Administration.

Department of Labor 404(a)(5) disclosures
The Department of Labor (DOL) established the 404(a)(5) regulation to ensure all workplace plan participants receive clear, comparative fee information before investing. Under these rules, plan administrators must provide an annual comparative chart that displays:
- Total annual operating expenses expressed as both a percentage and a dollar amount per $1,000 invested.
- Historical investment performance benchmarks over 1-, 5-, and 10-year periods.
- Plan-level administrative expenses (such as recordkeeping, legal, and accounting services).
- Individual service fees that apply to specific participant actions (such as distribution fees or qualified domestic relations order processing).
Hidden fee layers: 12b-1 and revenue sharing
Beyond the base investment management fee, some funds include additional fee layers embedded inside the published expense ratio:
- 12b-1 Fees: Annual marketing and distribution fees paid out of fund assets to cover broker commissions or advertising.
- Sub-Transfer Agency (Sub-TA) Fees: Payments made to recordkeepers for maintaining individual participant accounting records.
- Revenue Sharing: An arrangement where the mutual fund company shares a portion of its internal expense ratio with the plan’s recordkeeper to offset plan administration costs.
While revenue sharing can help cover administrative expenses that your employer might otherwise pass through as a direct account deduction, it can make it harder to see the true cost of your underlying investment options.
Practical steps to lower your 401(k) investment fees
- Review the 404(a)(5) comparative chart: Look up the net expense ratio for every fund currently in your portfolio.
- Compare similar fund options: If you hold a high-cost active fund, check if your plan offers a low-cost index alternative in the same asset category.
- Review default target-date allocations: Ensure your target-date fund uses cost-effective underlying holdings rather than higher-cost proprietary funds.
- Check for flat administrative charges: Review your quarterly statement to see if your plan charges flat account maintenance or recordkeeping fees.
- Capture your full employer match first: Even if your plan has above-average fund expenses, an employer matching contribution provides an immediate return that outweighs short-term fee differences.
- Maintain appropriate diversification: Reducing fees is important, but your portfolio should always reflect your personal risk tolerance, time horizon, and retirement goals.
Frequently asked questions about 401(k) fees
What is revenue sharing in a 401(k) plan?
Revenue sharing occurs when a mutual fund provider pays a portion of its internal management fee back to the plan recordkeeper or third-party administrator. This payment is embedded within the fund’s expense ratio and helps offset administrative, recordkeeping, or technology costs for the plan.
How often are expense ratios deducted from my account?
Expense ratios are calculated as an annual percentage, but they are deducted incrementally on a daily basis from the fund’s total assets. Because these expenses are built directly into the fund’s daily Net Asset Value (NAV), you will not see them listed as a separate line item on your quarterly statement.
Should I stop contributing to a high-cost 401(k)?
In most cases, you should continue contributing at least enough to capture your full employer match, as the match and initial tax advantages generally provide greater financial benefits than the drag created by higher fees. For contributions beyond the employer match, you can carefully evaluate the remaining investment options in your plan lineup alongside your overall retirement strategy.
Key takeaways
- A 401(k) expense ratio is an ongoing operational cost deducted directly from fund assets, reducing net investment returns.
- Review your annual DOL 404(a)(5) fee disclosure and fund prospectuses to identify gross and net expense ratios.
- Actively managed funds typically have higher expense ratios than passively managed index funds due to research and trading costs.
- Evaluating fund expenses alongside your employer match, asset allocation, and tax benefits ensures a balanced retirement strategy.
Conclusion
Understanding your 401(k) expense ratios allows you to make informed decisions about your retirement portfolio. Regularly reviewing your plan disclosures, comparing fund costs across identical asset classes, and keeping an eye on administrative fees can help ensure that more of your money remains invested for the future.
At 401(k) Maneuver, we provide professional, personalized 401(k) account management designed to help you navigate investment choices, manage downside risk, and monitor ongoing plan costs. To learn how our team can help you manage your workplace retirement account, learn how 401(k) Maneuver works or call us at 1-877-218-5060 for a no-pressure conversation.
Disclosures: 401(k) Maneuver is a business name of Royal Fund Management, LLC, an SEC-registered investment adviser. This article is provided for educational and informational purposes only and should not be construed as individualized investment, legal, or tax advice. Investing involves risk of loss, including the possible loss of principal. Diversification and portfolio rebalancing strategies do not guarantee a profit or protect against loss in declining markets. Past performance does not guarantee future results.